ROOCS usage by year
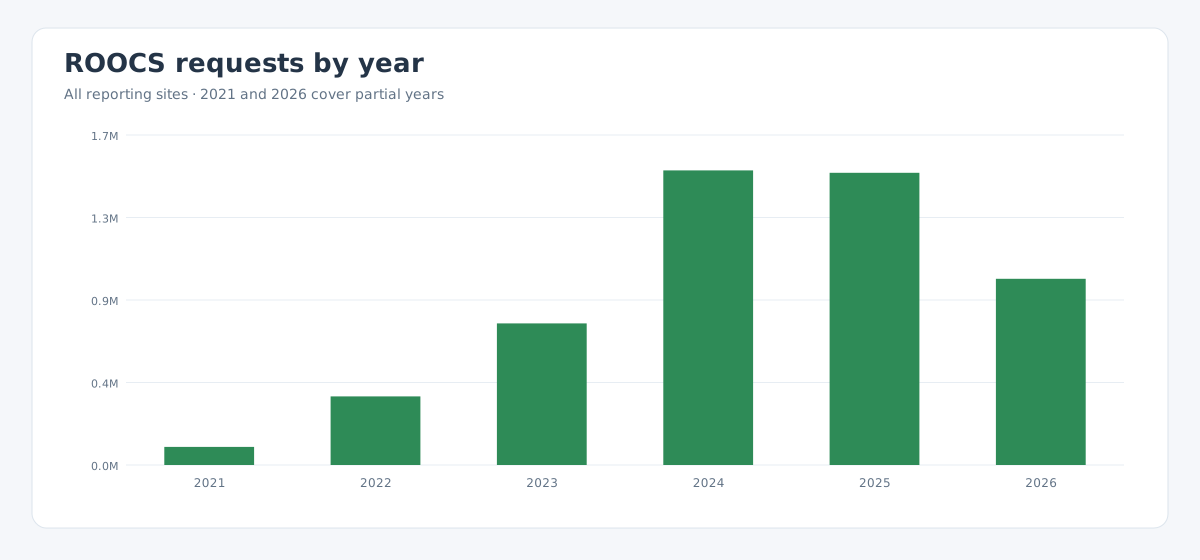
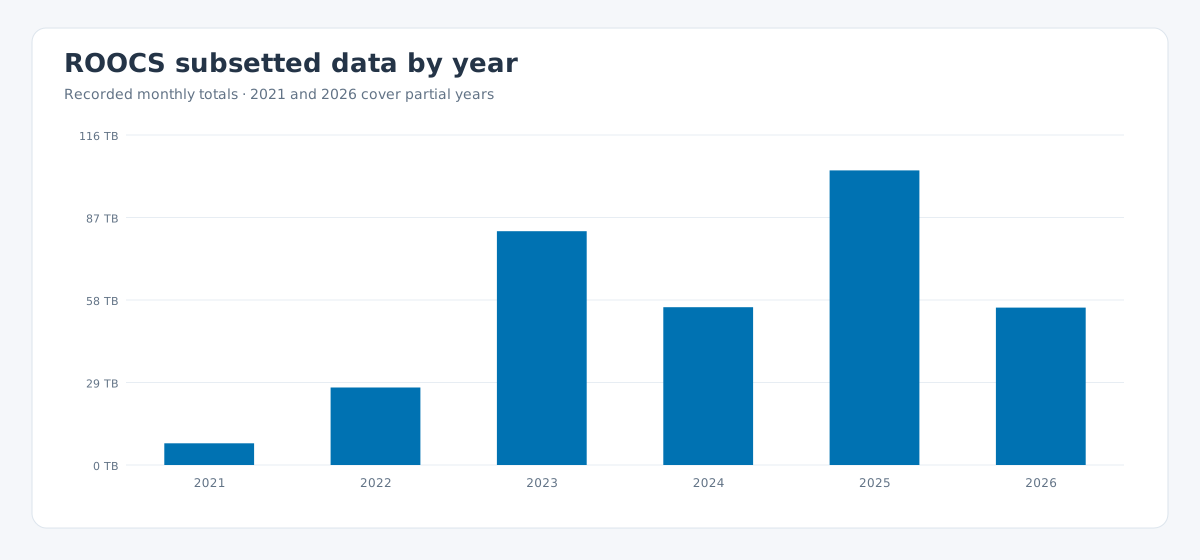
This overview shows the total number of requests processed and the recorded volume of subsetted data for each reporting year. Detailed request outcomes, site breakdowns, and monthly charts are available from the linked annual pages.
For the latest cached health checks, see Service status.
| Year | Coverage | Requests | Subsetted data |
|---|---|---|---|
| 2021 | March–December (recorded) | 94,254 | 7.62 TB |
| 2022 | January–December | 357,821 | 27.16 TB |
| 2023 | January–December | 738,432 | 81.97 TB |
| 2024 | January–December | 1,536,287 | 55.32 TB |
| 2025 | January–December | 1,523,415 | 103.30 TB |
| 2026 | January–June (year to date) | 970,973 | 55.19 TB |
ROOCS is designed to subset large datasets before delivery. Transferred volume is therefore not a metric to maximize: for equivalent scientific requests, less data transferred generally means more effective subsetting and lower network and storage costs.
Requests
Subsetted data
Comparability
The 2021 series starts in March, and its transfer total reflects the values recorded in the archived monthly exports; those exports are known to be incomplete. The 2026 figure currently covers January through June and will grow as later reports are added. See the individual annual pages for source-specific notes.