ROOCS 2023 annual summary
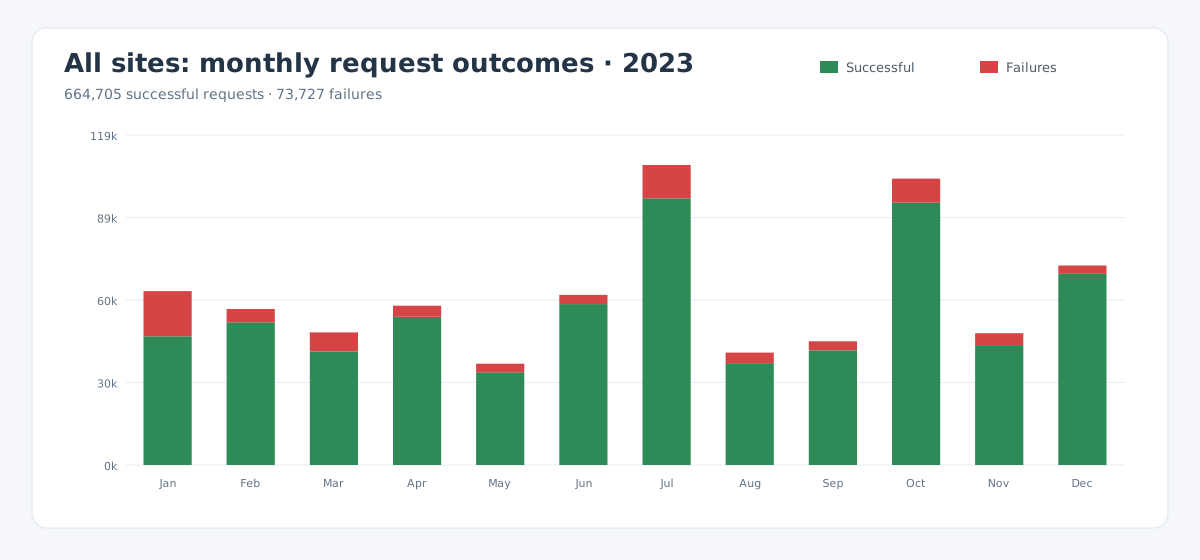
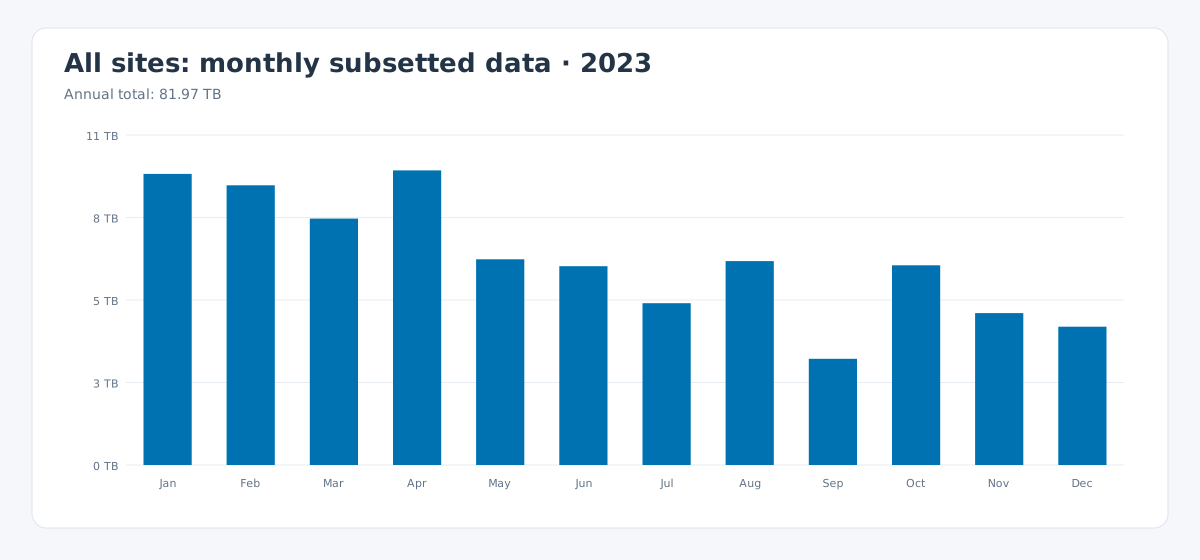
This report summarizes monthly usage of the ROOCS subsetting services operated by DKRZ and IPSL during 2023. Together, the services processed 738,432 requests, of which 664,705 were successful, and delivered 81.97 TB of subsetted data.
| Scope | Requests | Successful | Failures | Subsetted data | Peak concurrency |
|---|---|---|---|---|---|
| All sites | 738,432 | 664,705 | 73,727 (9.98%) | 81.97 TB | 40 |
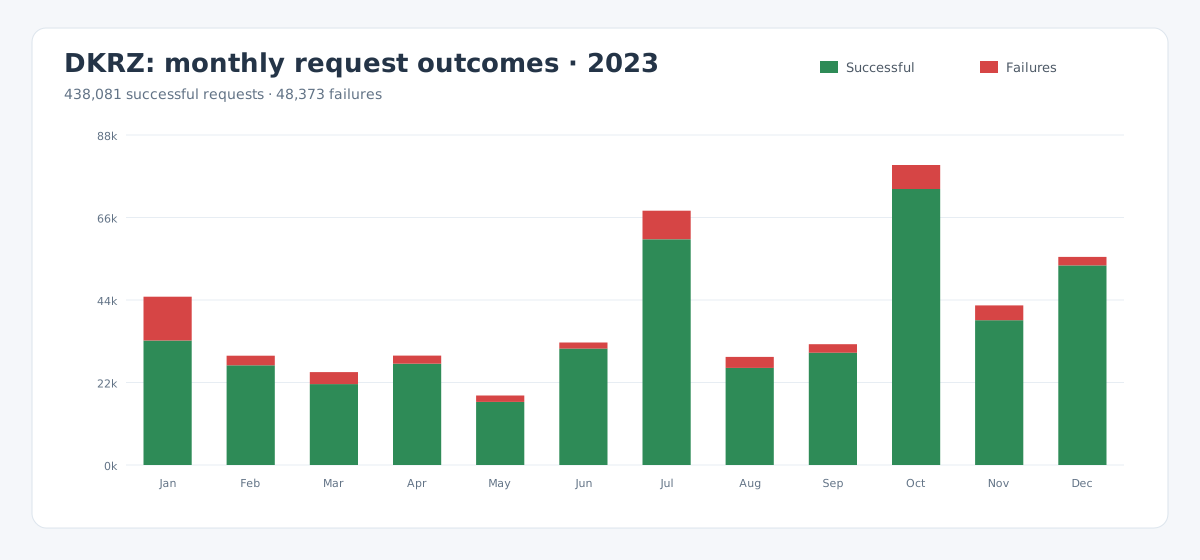
| DKRZ | 486,454 | 438,081 | 48,373 (9.94%) | 52.10 TB | 31 |
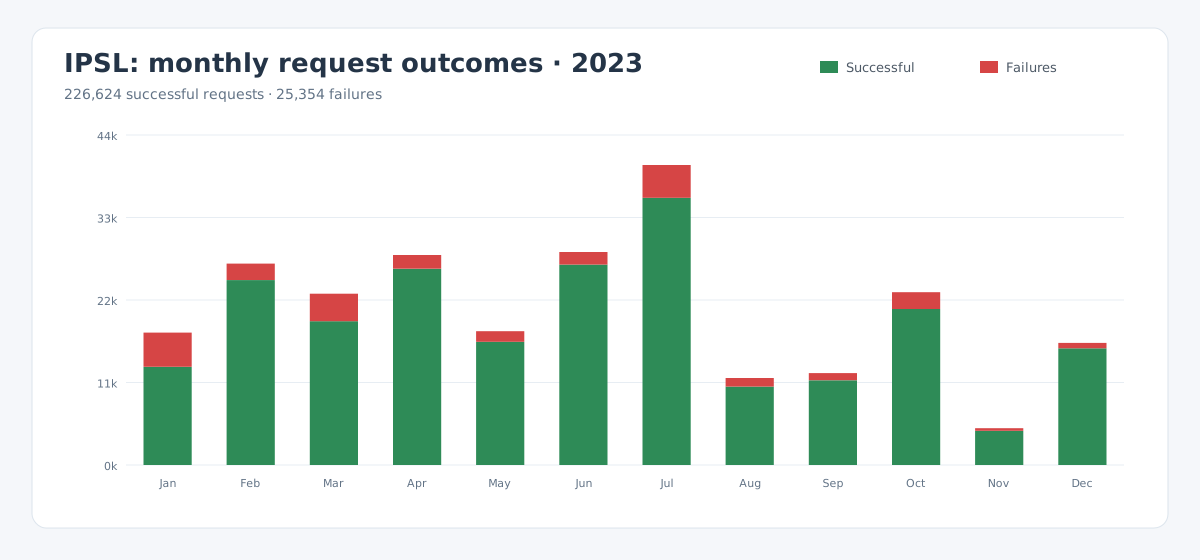
| IPSL | 251,978 | 226,624 | 25,354 (10.06%) | 29.87 TB | 40 |
Monthly request outcomes
The green portion of each bar represents successful requests; failures are shown in red.
All sites
DKRZ
IPSL
Understanding the failures
Most failed requests were caused by users accessing the services directly through the CDS API rather than through the CDS portal. In this workflow there is no CDS catalogue interface to guide or validate the available parameters, so users commonly rely on trial and error to discover valid request combinations. These invalid requests are counted as failures even though the service itself is operating normally.
A smaller share resulted from temporary infrastructure problems, such as full temporary disks or unavailable Lustre storage. The statistics also include genuine processing failures discovered during normal operation, including issues related to calendar handling. The available dashboard data does not provide a reliable numerical breakdown among these causes.
Monthly subsetted data
The monthly values combine the data delivered by DKRZ and IPSL.
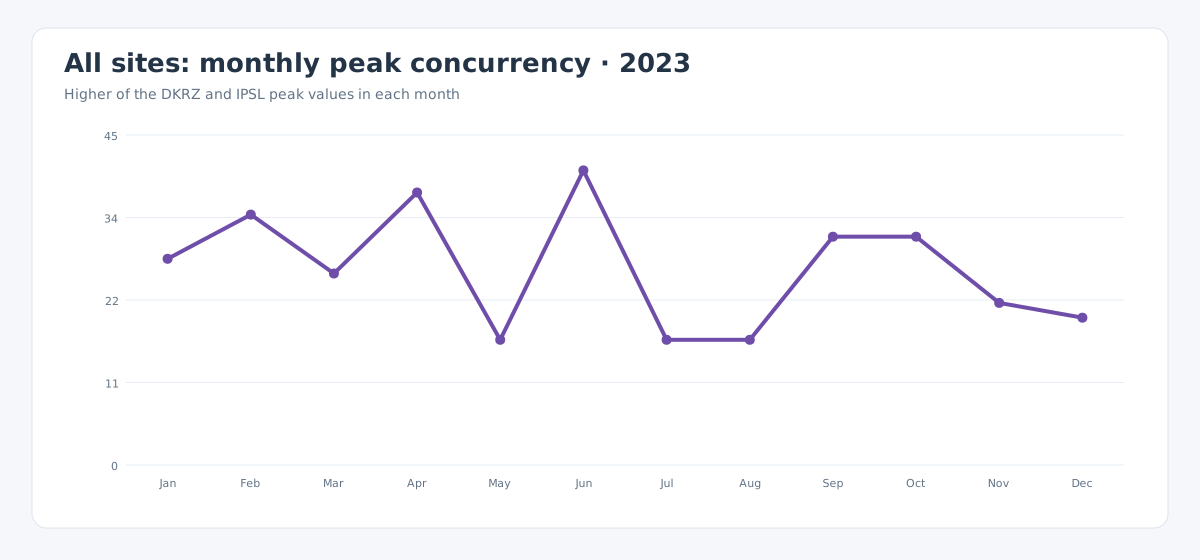
Monthly peak concurrency
For each month, overall concurrency is the higher of the DKRZ and IPSL peak values. The site peaks are not added because they may have occurred at different times.
Data and methodology
Request, failure, and subsetted-data totals are sums of the monthly DKRZ and IPSL dashboard exports. Successful requests are calculated as total requests minus failed requests. Peak concurrency is not additive: the combined monthly series uses the higher site value, and the annual value is its maximum.
Source note: the January IPSL file spans both January and February, and the October IPSL monthly export is missing. January and October request outcomes and concurrency were therefore recovered from the daily series in the Q1 and Q4 exports. The IPSL transfer exports are incomplete for those periods, so this summary uses the monthly estimates recorded in the existing 2023 dashboard: 5,339 GB for January, 4,000 GB for February, 2,340 GB for March, and 500 GB for October.