ROOCS 2021 annual summary
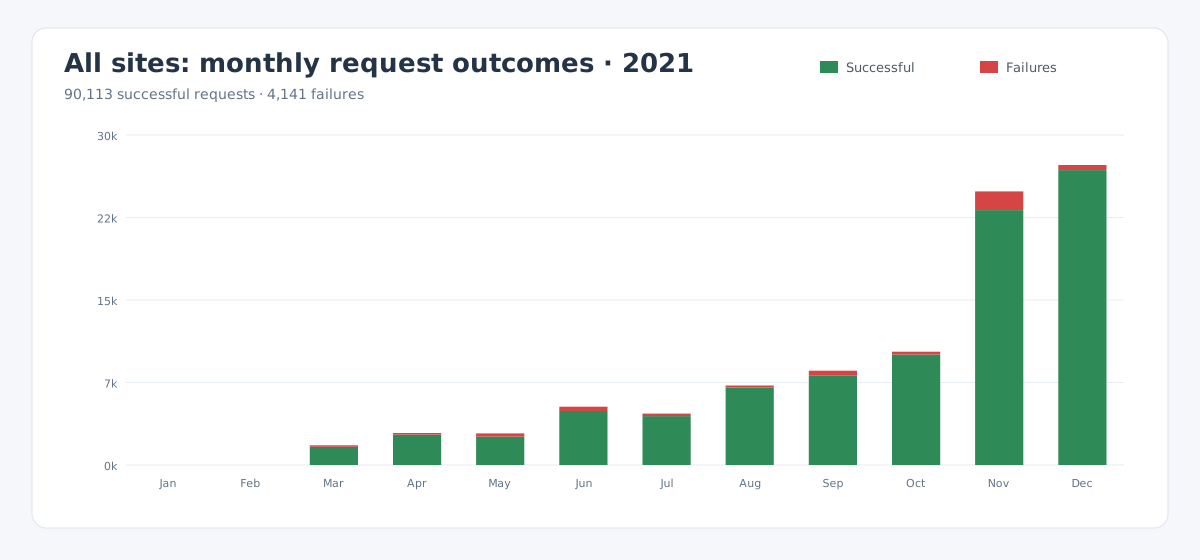
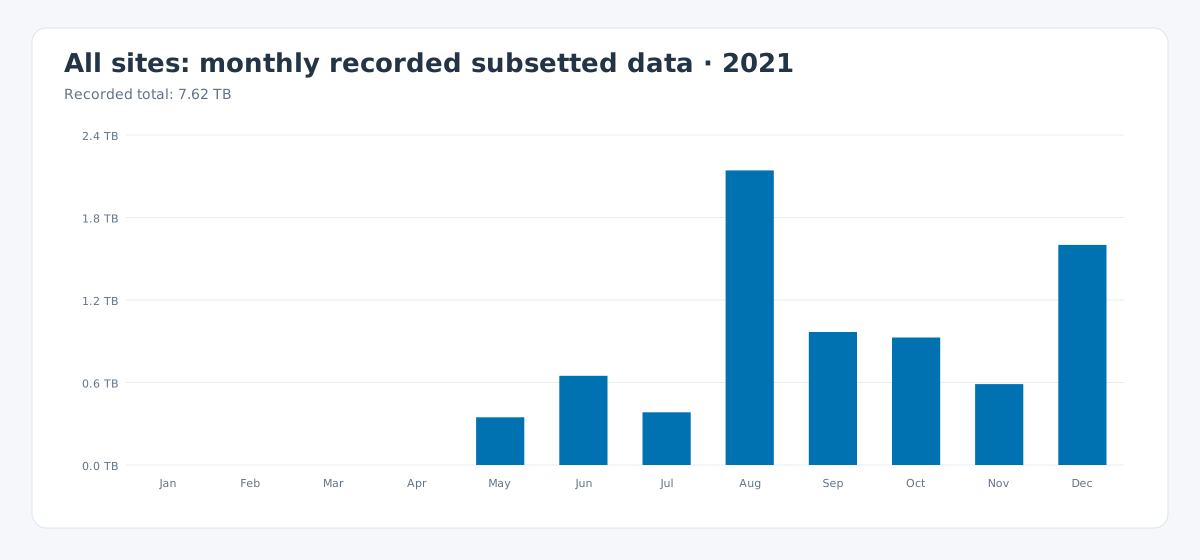
Monthly ROOCS reporting began in March 2021. From March through December, the available combined exports record 94,254 requests, of which 90,113 were successful, and 7.62 TB of subsetted data across DKRZ and CEDA.
| Scope | Requests | Successful | Failures | Recorded subsetted data | Peak concurrency |
|---|---|---|---|---|---|
| All sites, March–December | 94,254 | 90,113 | 4,141 (4.39%) | 7.62 TB | 80 |
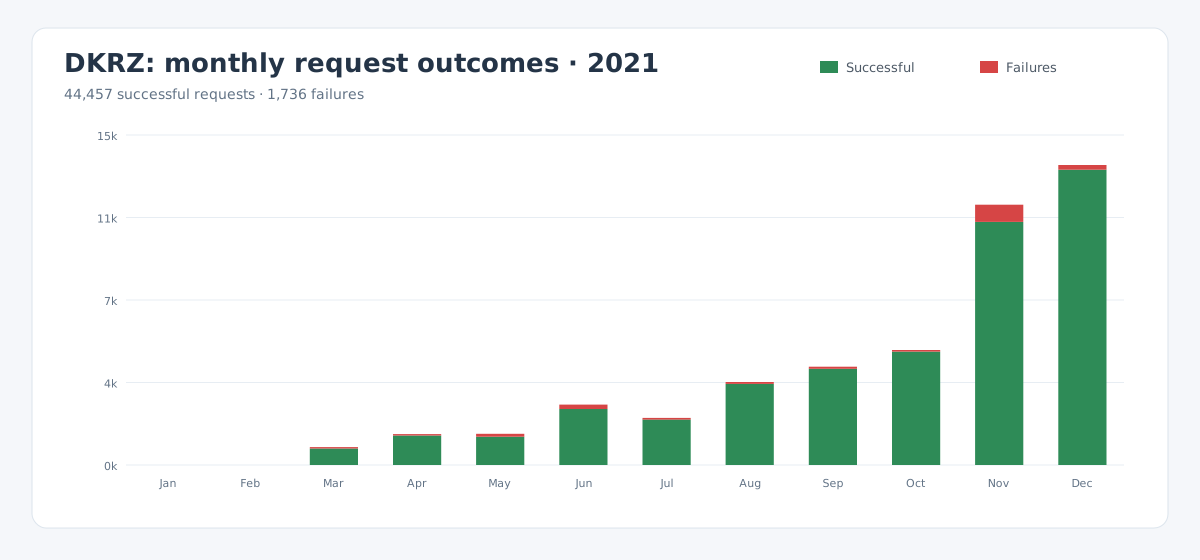
| DKRZ | 46,193 | 44,457 | 1,736 (3.76%) | 5.44 TB | 37 |
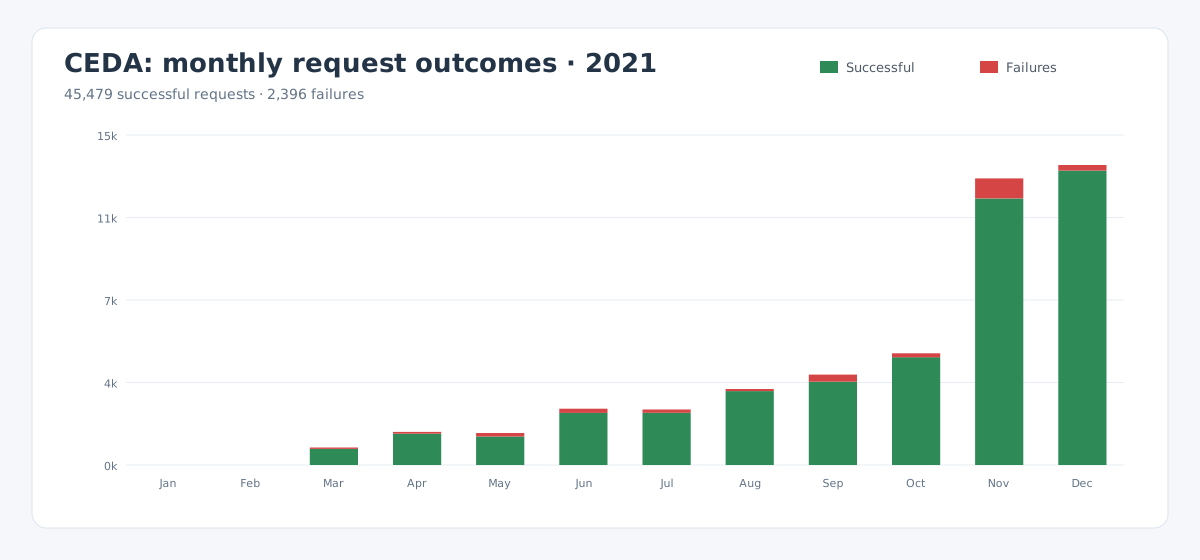
| CEDA | 47,875 | 45,479 | 2,396 (5.00%) | 1.18 TB | 80 |
The DKRZ and CEDA request figures cover March–December. Their transfer columns only contain the available site-level July–December values; March–June transfer cannot be divided reliably between the sites.
Monthly request outcomes
The green portion of each bar represents successful requests; failures are shown in red. January and February are empty because monthly reporting had not yet started.
All sites
DKRZ
CEDA
Understanding the failures
Most failed requests were caused by users accessing the services directly through the CDS API rather than through the CDS portal. In this workflow there is no CDS catalogue interface to guide or validate the available parameters, so users commonly rely on trial and error to discover valid request combinations. These invalid requests are counted as failures even though the service itself is operating normally.
A smaller share resulted from temporary infrastructure problems, such as full temporary disks or unavailable Lustre storage. The statistics also include genuine processing failures discovered during normal operation, including issues related to calendar handling. The available dashboard data does not provide a reliable numerical breakdown among these causes.
Monthly subsetted data
The chart shows the transfer volume recorded in the combined monthly exports.
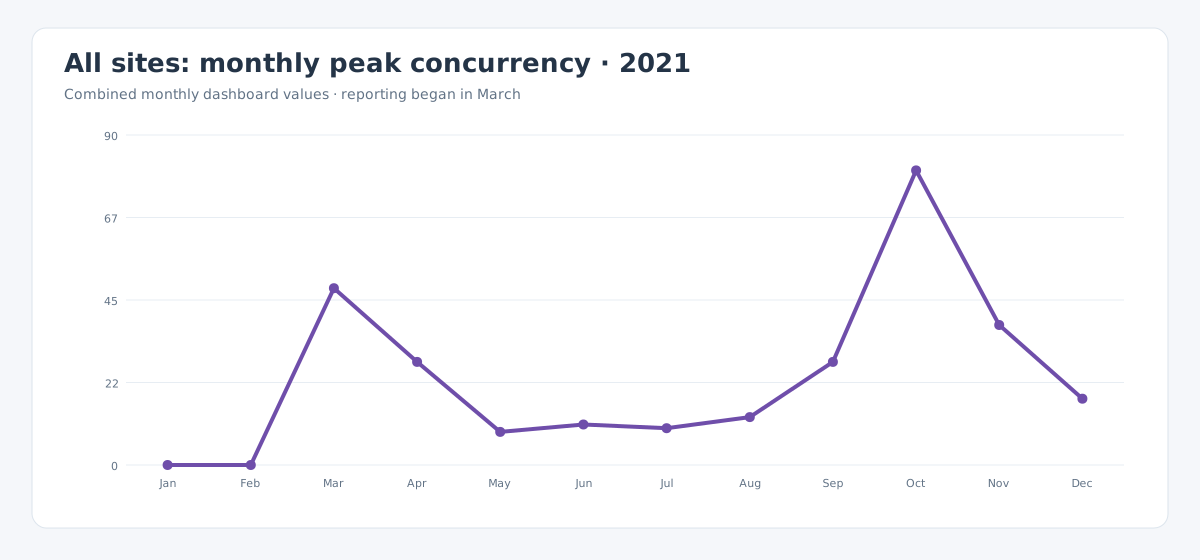
Monthly peak concurrency
The chart uses the combined monthly export because the site split is not available for the first part of the reporting period.
Data and methodology
Combined monthly exports provide the overall request, failure, transfer, and concurrency series. DKRZ and CEDA request outcomes for March–June were recovered from the corresponding daily series in the full-year site exports; monthly site exports are available from July onward.
The archived monthly files record 6.62 TB for July–December, while the existing 2021 dashboard page reports a rounded total of 11 TB for that period. This summary retains the reproducible monthly values and therefore describes its 7.62 TB annual figure as recorded data rather than a complete transfer total.
The full-year overview reports 95,096 requests and 4,179 failures, compared with 94,254 requests and 4,141 failures obtained by summing the monthly combined exports. The site-level series also differ slightly from the combined series. This summary consistently uses the monthly combined values for the overall totals and charts, while showing the available site-series values separately.